SonicWall™ Cloud GMS Quick Start Guide
This document covers the basic functionality on how to:
|
3
|
Introduction to Policy Management
|
|
4
|
Introduction to Reporting
|
Refer to the steps that follow and the Cloud GMS Online Help for detailed steps and in-depth descriptions on the features of the product.
Supported Firewalls
MySonicWall Setup
Prerequisites
You need a MySonicWall account: Sign up at https://www.mysonicwall.com/user/registration.aspx
Summary of Steps to Adding Unit to Cloud GMS
|
4
|
Log in to the firewall and configure the GMS Management settings to point to cloudgms.global.sonicwall.com to manage the firewall from a US-based datacenter, or to cloudgmsams.global.sonicwall.com to manage the firewall from a European-based datacenter.
|
|
5
|
Click back to the Cloud GMS instance at www.MySonicCloud.com and log in to the Cloud GMS user interface.
|
Any changes to the settings disrupts the Cloud GMS management and report generation capability.
In addition to the above settings, Cloud GMS creates a Reporting tunnel between the firewall and Cloud GMS to upload the reporting data securely with a prefix “SGMS-<fw serial number>”. Do not make any changes to this tunnel.
Activating Cloud GMS
|
1
|
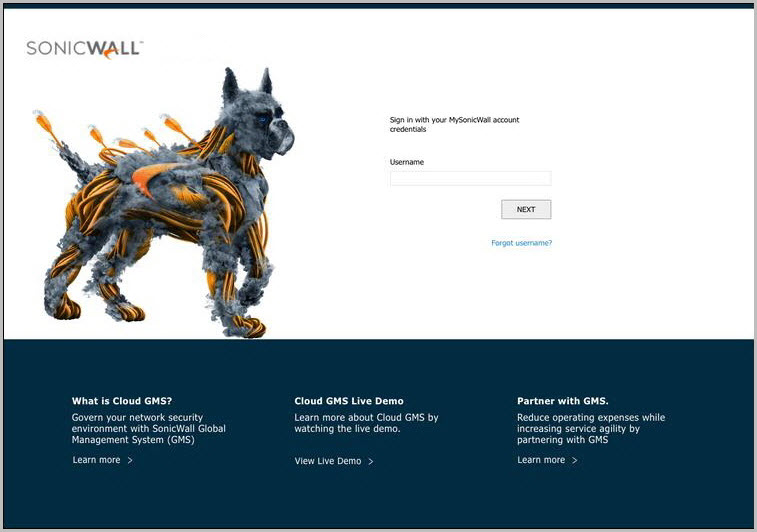
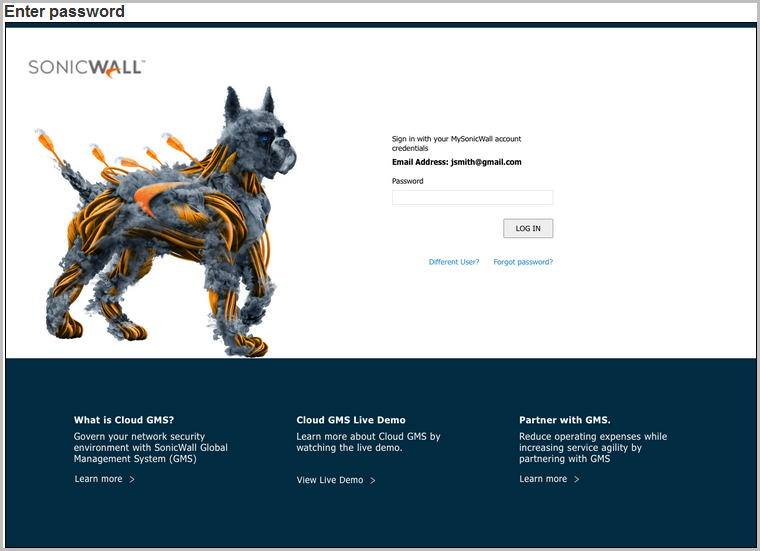
Log in to www.MySonicCloud.com by signing in with your MySonicWall account credentials, and follow the login instructions.
|
|
2
|
Click Next.
|
|
4
|
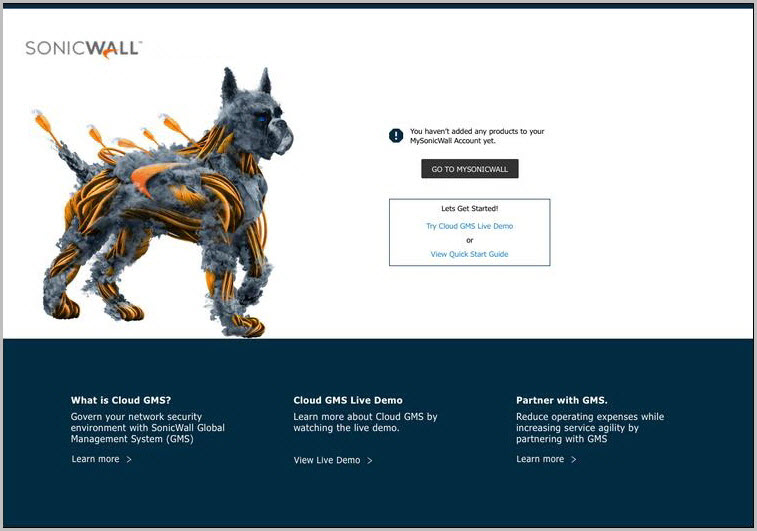
Activate Cloud GMS by clicking Go to MySonicWall and completing the registration process.
|
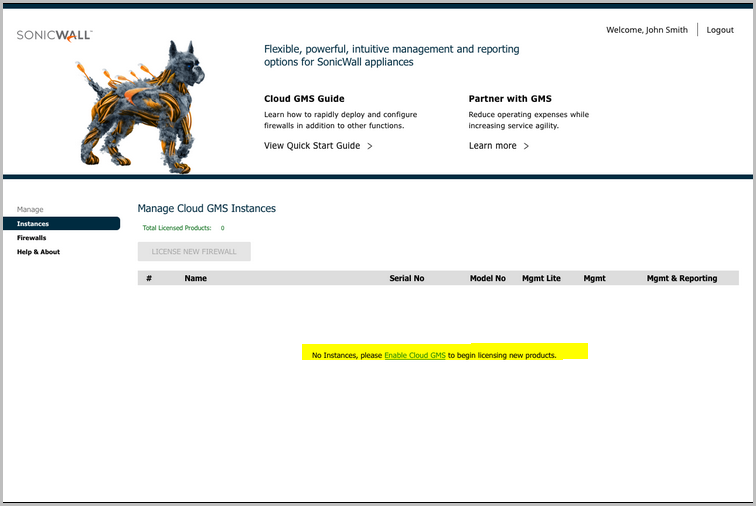
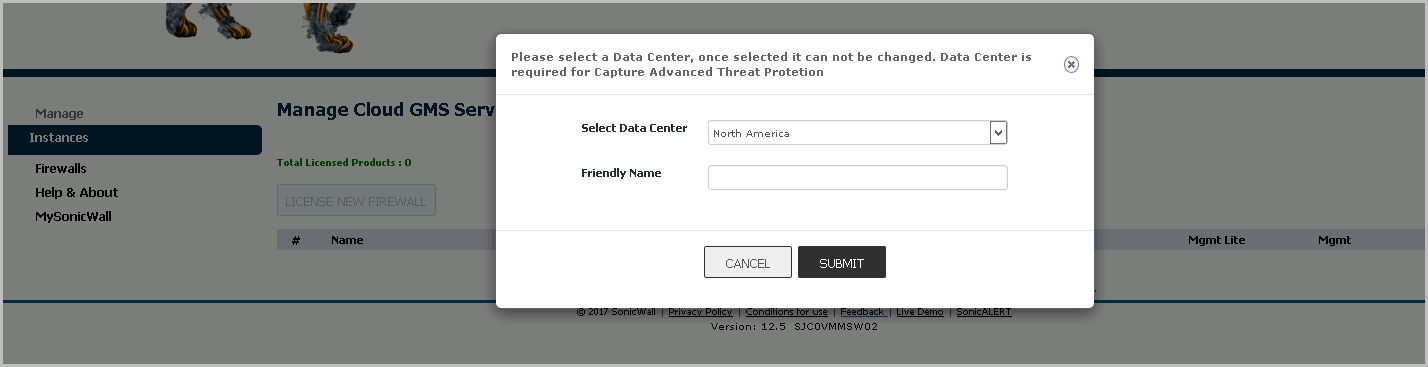
If no Instances are available to license, click Enable Cloud GMS to provision a new Instance.
|
6
|
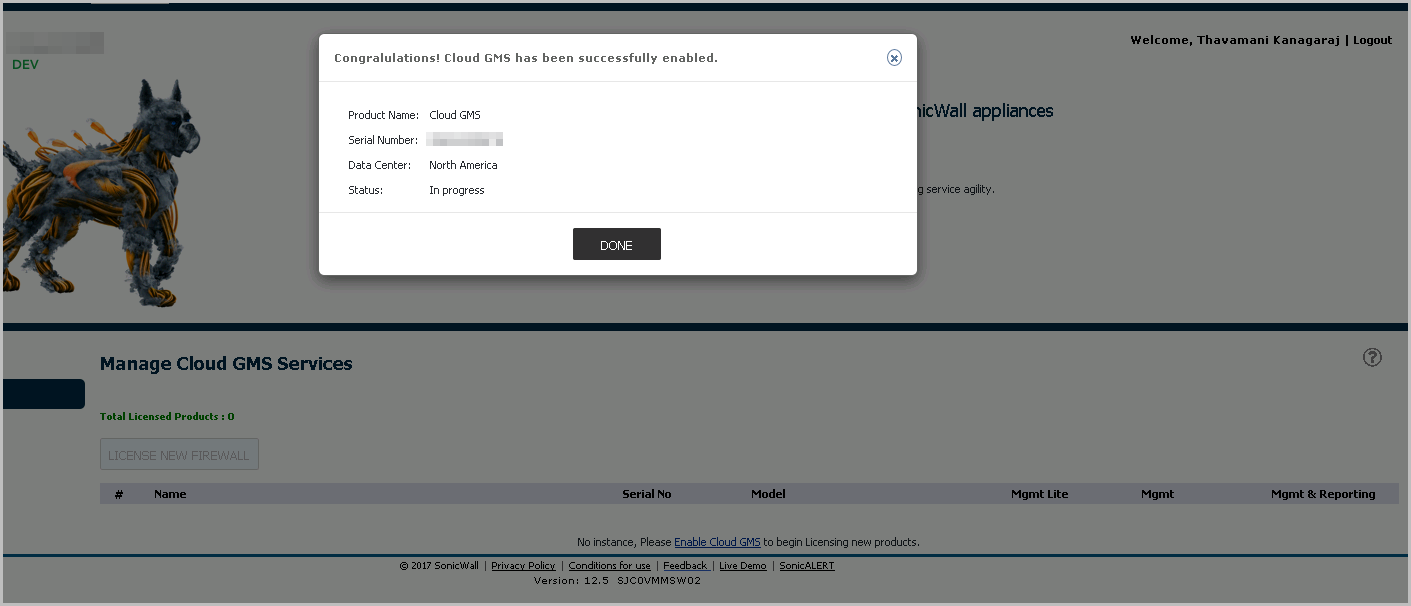
“Congratulations! Cloud GMS has been successfully enabled.”
|
7
|
Click Done.
|
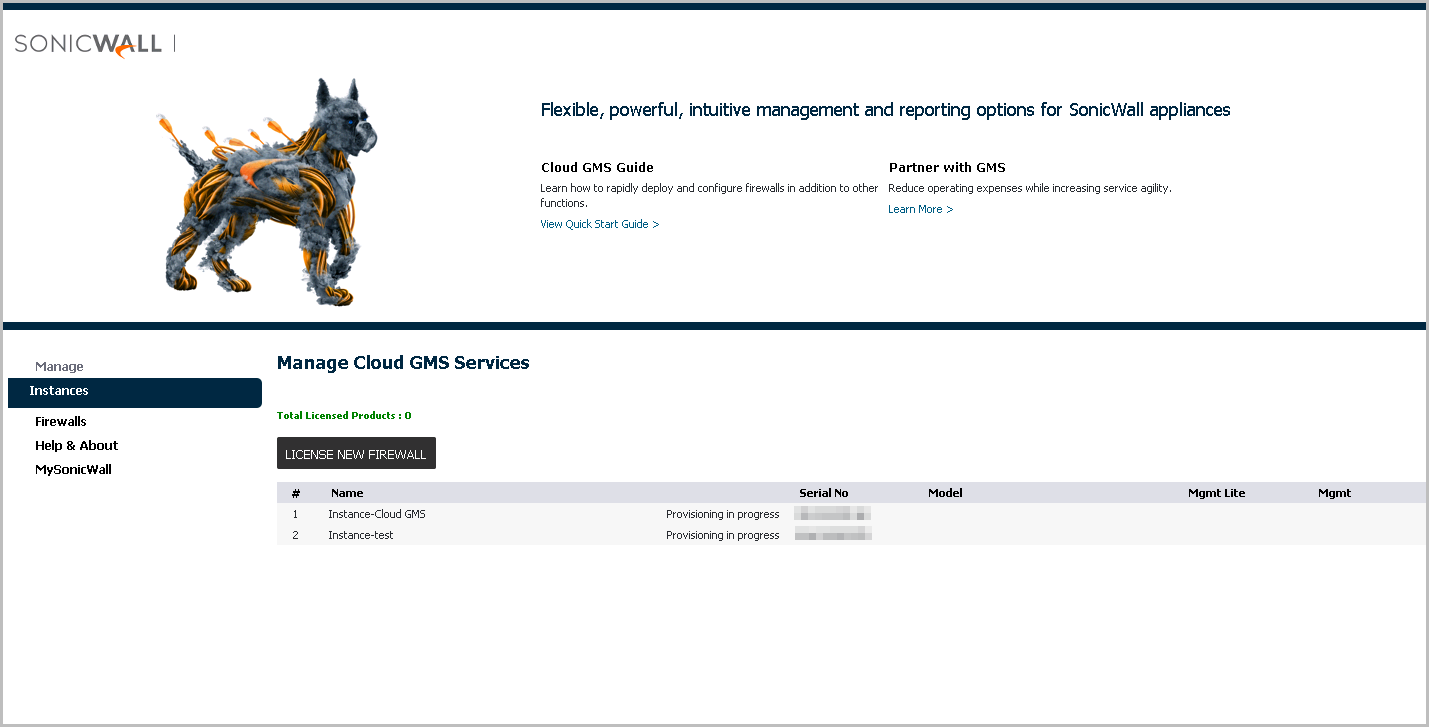
A list of licensed Instances along with their Friendly Names displays.
|
8
|
Click Instances.
|
|
9
|
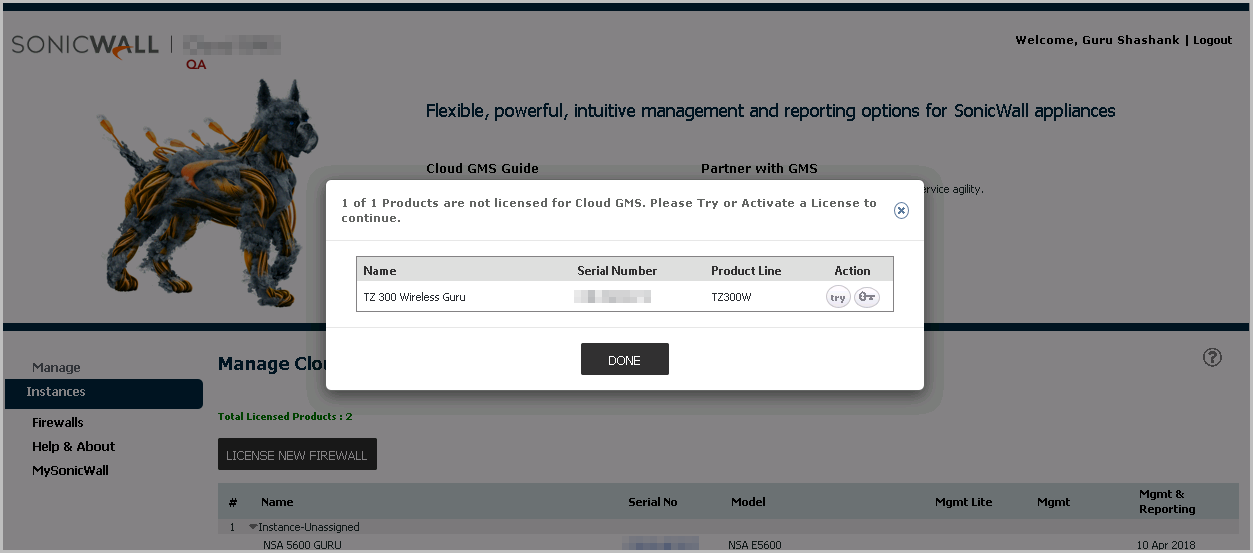
After clicking License New Firewall, a popup appears where you can Try or Activate Cloud GMS services on one or all of your registered firewalls.
|
|
10
|
Clicking Try activates a trial license of the Cloud GMS Management + Reporting service for 30 days. Using the Try option deactivates the datacenter option as provisioning has already been established.
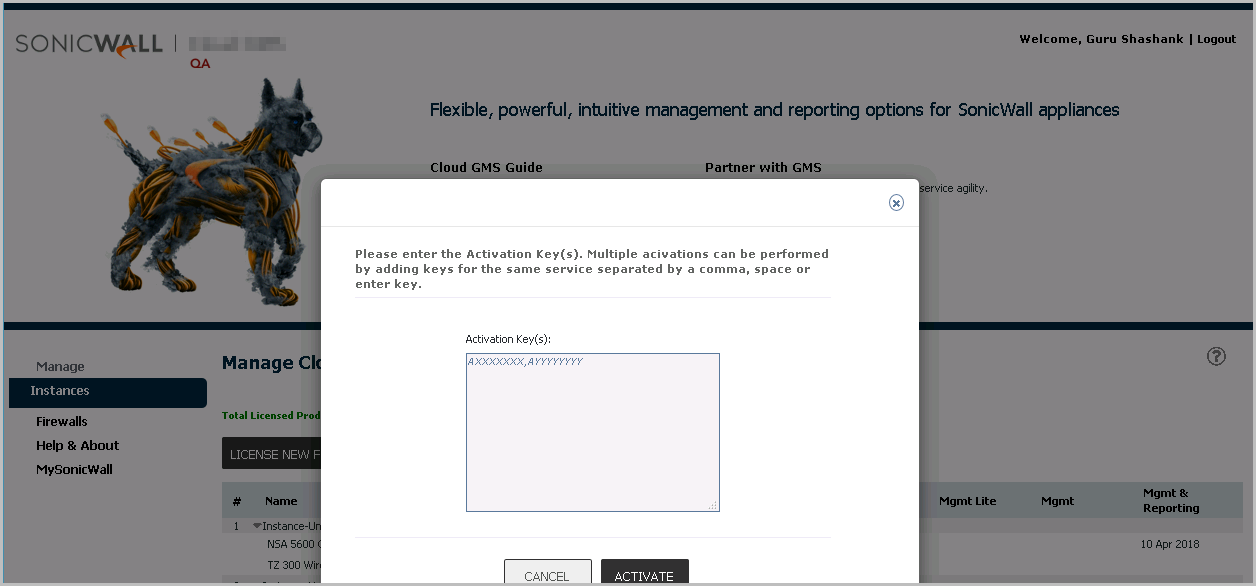
Click Activate to enable multiple activation keys for the Cloud GMS services available for this product.
|
NOTE: The option to License New Firewall does NOT appear if no Cloud GMS Instances are registered to you. This is possible if you are activating the service in MySonicWall where automatic provisioning of the tenant is done even when no Instances are registered.
|
|
11
|
|
12
|
Before you continue to Add a New Unit into Cloud GMS, you will need to activate one of three services; Cloud GMS Management and Reporting, Cloud GMS Management Only, or Cloud GMS Basic for every firewall.
|
|
a
|
Log in to www.mysonicwall.com using the ID that you used to activate Cloud GMS.
|
|
b
|
Navigate to My Products > Product Management.
|
|
d
|
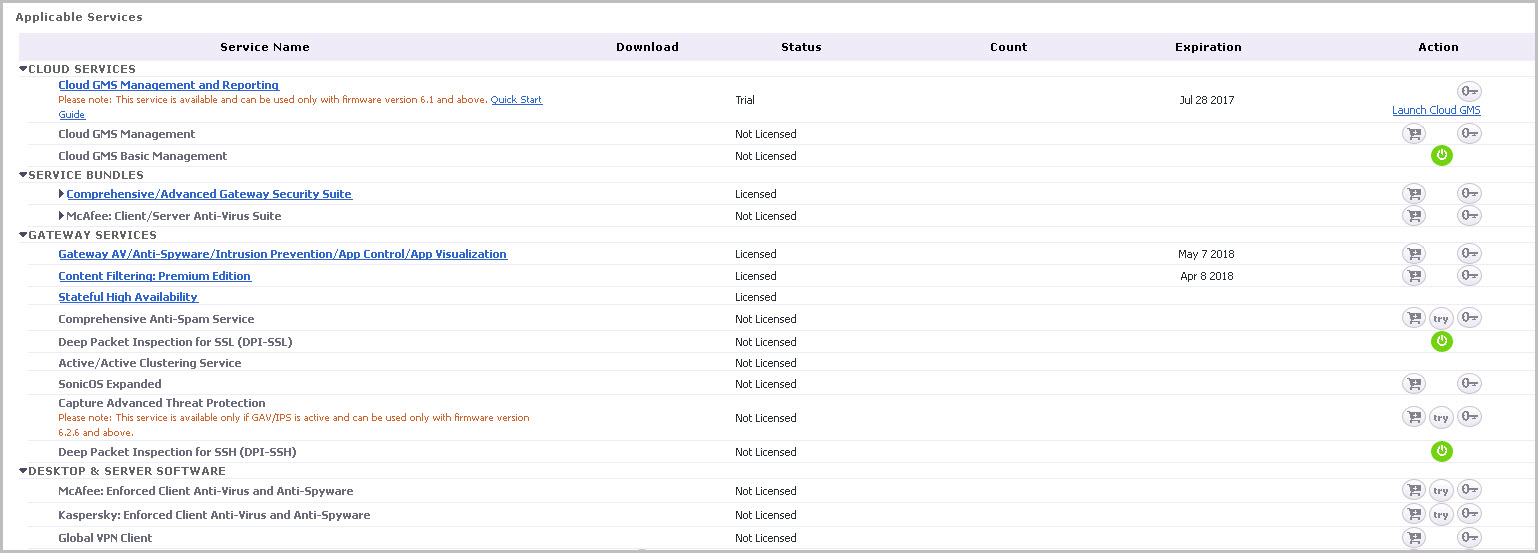
Page down to Applicable Services > Desktop and Server Software.
|
|
e
|
Click Try under Cloud GMS Management and Reporting.
|
Managing Firewalls
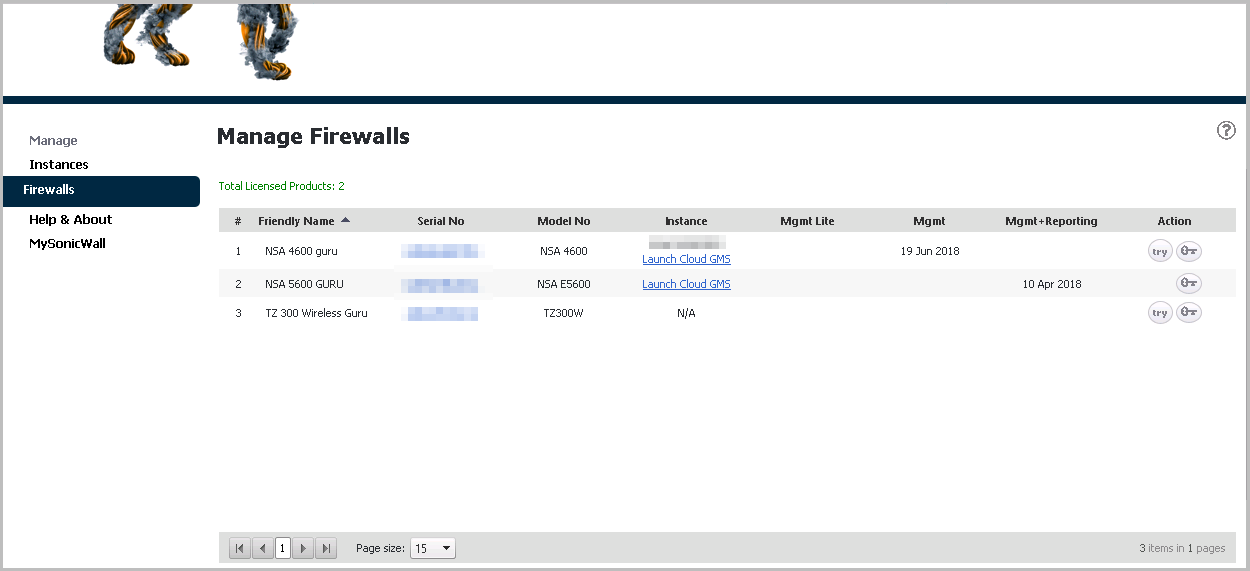
To manage a firewall,
|
1
|
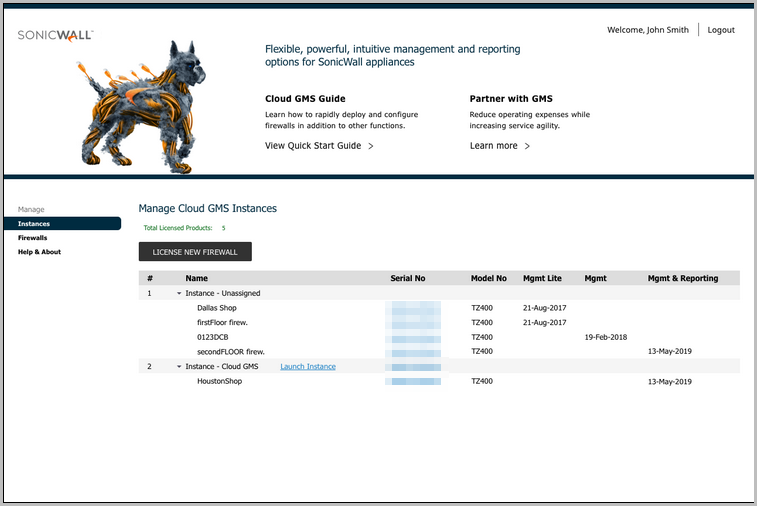
Click the firewall serial number to access the MySonicWall service management screen.
|
|
2
|
Click the Instance serial number to access the Cloud GMS system.
|
|
3
|
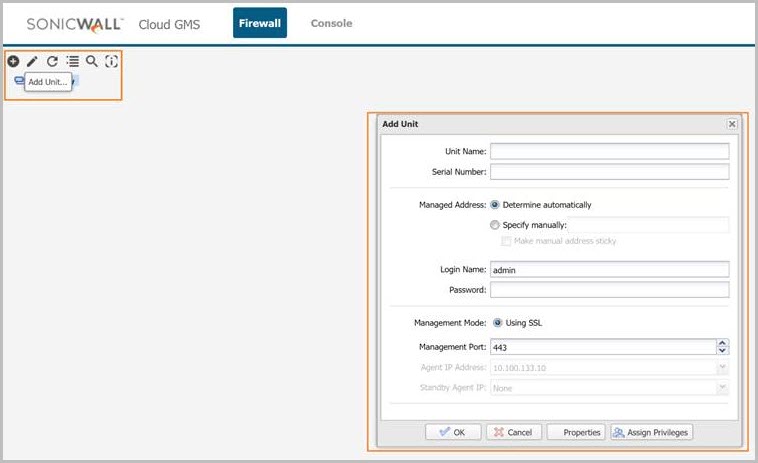
Provisioning and Adding Units
Adding new SonicWall appliances to Cloud GMS
Log in to www.MySonicCloud.com using the same credentials you used to activate the Cloud GMS service.
Step 1: Adding Unit to Cloud GMS
|
c
|
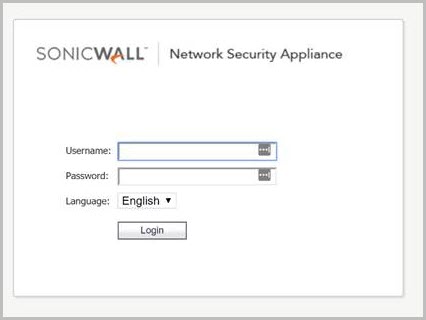
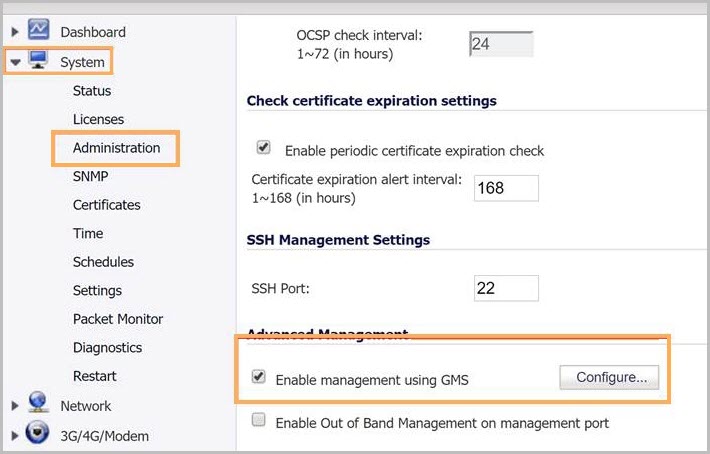
Step 2: Configuring the firewall for management with Cloud GMS
|
2
|
Navigate to System > Administration.
|
|
a
|
Click Enable management using GMS.
|
|
3
|
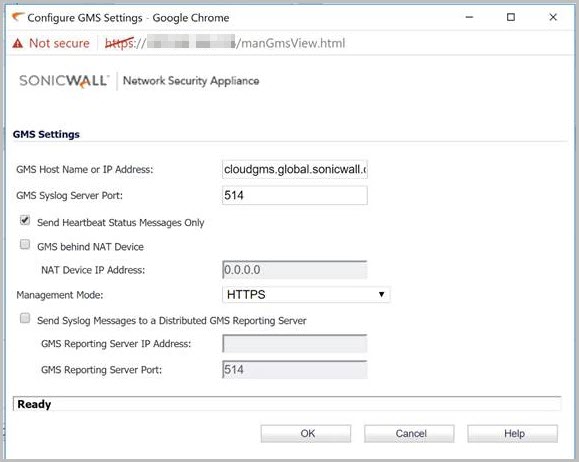
Click Configure.
|
|
4
|
|
a
|
Enter cloudgms.global.sonicwall.com to the GMS Host Name or IP Address field to connect the firewall to a US-based datacenter, or enter cloudgmsams.global.sonicwall.com to connect the firewall to a European-based datacenter.
|
|
b
|
|
c
|
Check Send Heartbeat Status Messages Only.
|
|
d
|
Click OK.
|
|
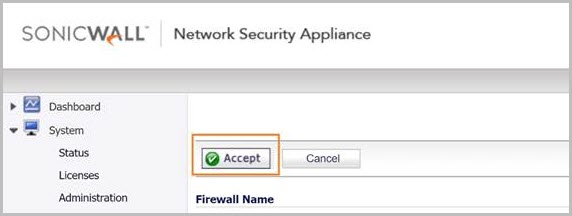
e
|
Click Accept on the page that follows.
|
|
NOTE: Check the Console Panel > View Logs for any errors or warning messages when the licensing synchronization does not correctly synchronize the licenses for the unit.
If the middle panel does not appear, but the Status screen shows the license as Active, you can reload the browser once to view the contents of the middle panel. |
Step 3: Configuring perimeter routers and gateways that allow Cloud GMS access to the firewall
Advanced Firewall Configuration
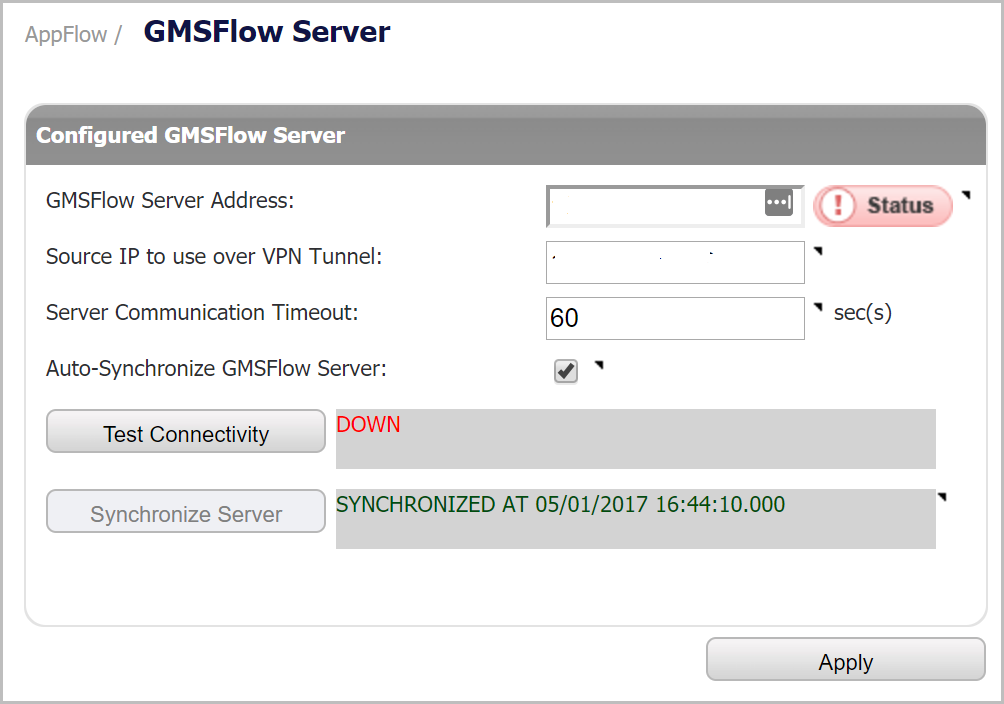
Auto-configuration for Reporting
Introduction to Policy Management and UI layout
Multi-firewall Management
Navigation Tabs
|
•
|
|
•
|
The Console tab provides tools to customize options and to manage the Cloud GMS settings that affect the environment.
Left Pane or Tree Control
Middle Pane
At the top of the Middle pane there are two sub-tabs:
|
•
|
Policies - Provides policy configuration options for managed appliances.
|
|
•
|
Flows - Provides IPFIX-based Flow Reporting at the global, group, or appliance level. The current selection in the center pane is indicated by the highlighted item.
|
The Middle pane options change based on the navigational tab and the Left pane selections, and the selections in the Middle pane modify the display in the Right pane.
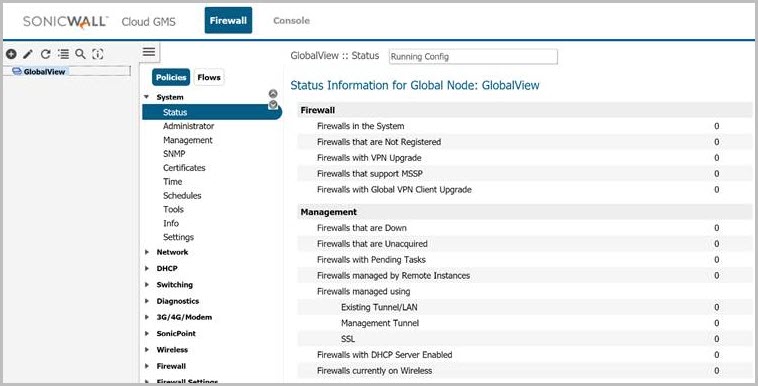
Right Pane
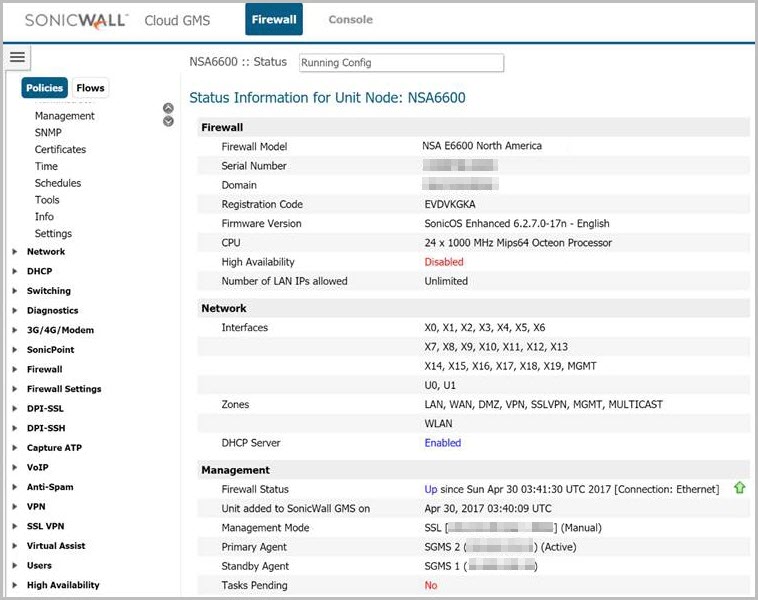
The Right pane displays the available status or tasks based on the current selection of the navigational tab and the Left pane and Middle pane options. Configurations completed in the Right pane modify the global, group, and appliance settings. For example, the Right pane image displays the status and tasks available for the Policies navigation tab, the Left pane selection in the GlobalView, and the Middle pane selection of System > Status.
Introduction to Reporting
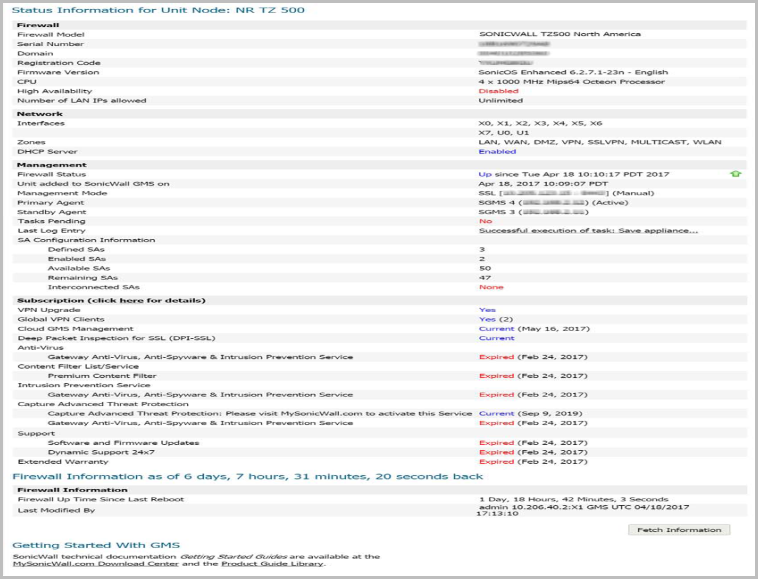
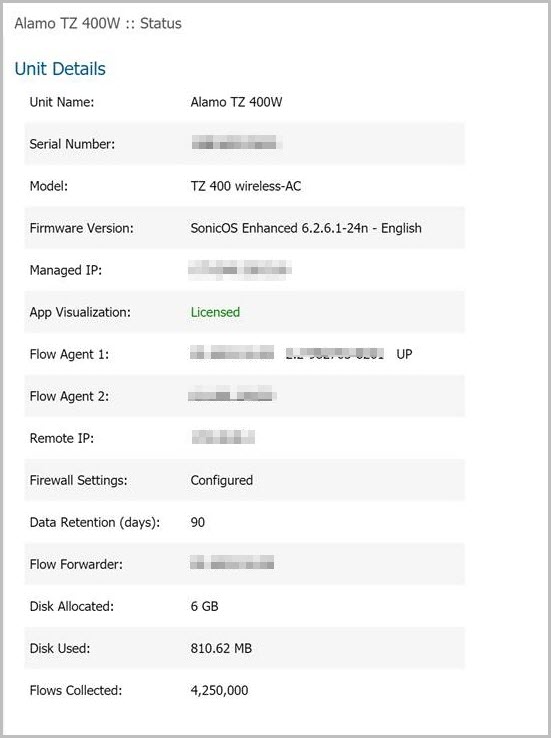
General > Status
The General > Status dialog shows reporting configuration information such as: Firewall information, Flow Agents Assignment, the Data Retention Period, and other critical information such as disk storage allocation and flows collected.
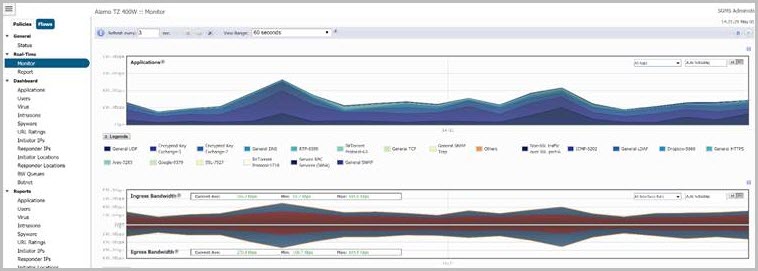
Real-Time > Monitor
|
•
|
Application bandwidth - Indicates applications that are flowing through the firewall in bits per second.
|
|
•
|
Per Interface Data - Indicates the bandwidth utilization in bits per second, average packets per second, average packets size, and new connection rates in connections per second
|
|
•
|
Device data - CPU utilization per core. Total active connections
|
Data visible on this page is limited to a maximum of 10 minutes. Individual charts can be rearranged manually by dragging and dropping the graph window. Mouse over the data in the graphs and you can drill-down to Flow Reports. The appearance of the chart can be customized by using the Settings button. Mouse-over the information icon or question marks to see context-sensitive help. Collapse or expand individual charts using the + or - icon in the upper right of each chart. Show or hide legends by clicking the Legends button.
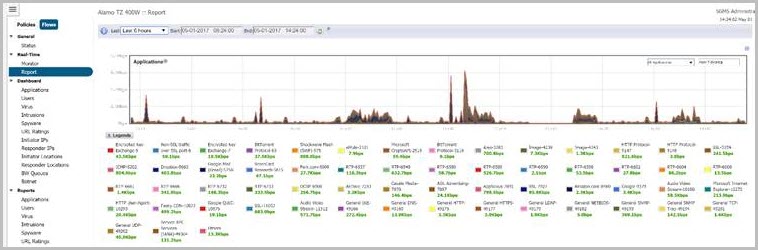
Real-Time > Report
This report provides historical views of the real-time monitor charts. You can choose and visualize real-time charts from any time period of recorded data using the Start and End boxes and clicking the Refresh icon. You can also choose either a specific time range in the past using the drop-down time menu or by using a custom time by clicking a start and a stop time on the graph. You can also select the last few hours, days, weeks, or months using the drop-down menu.
Dashboard > Applications
This provides a concise view of the Top Ten reports available based on following attributes:
|
•
|
Top Applications based on Sessions, Bytes, Virus, Spyware, Blocks, Intrusions, Geo-IP Blocks, Botnet Blocks
|
|
•
|
Top Users based on Sessions, Bytes, Virus, Spyware, Blocks, Intrusions, Geo-IP Blocks, Botnet Blocks
|
|
•
|
Top Virus based on Sessions
|
|
•
|
Top Intrusions based on Sessions
|
|
•
|
Top Spyware based on Sessions
|
|
•
|
Top URL Ratings categories based on Sessions and Bytes
|
|
•
|
Top Initiator IP addresses based on Sessions, Bytes, Virus, Spyware, Blocks, Intrusions, Geo-IP Blocks, Botnet Blocks
|
|
•
|
Top Responder IP addresses based on Sessions, Bytes, Virus, Spyware, Blocks, Intrusions, Geo-IP Blocks, Botnet Blocks
|
|
•
|
Top Initiator Locations based on Sessions and Bytes
|
|
•
|
Top Responder Locations based on Sessions and Bytes
|
|
•
|
Top BWM Queues based on Queue type, Sessions and Bytes
|
|
•
|
Top Botnets based on Sessions and Bytes
|
You can choose and visualize this data from any given moment using the Start and End boxes and clicking the Refresh button. You can also choose either a specific time range in the past by indicating a Custom Range or by selecting a drop down menu selection for the last few hours, days, weeks, or months.
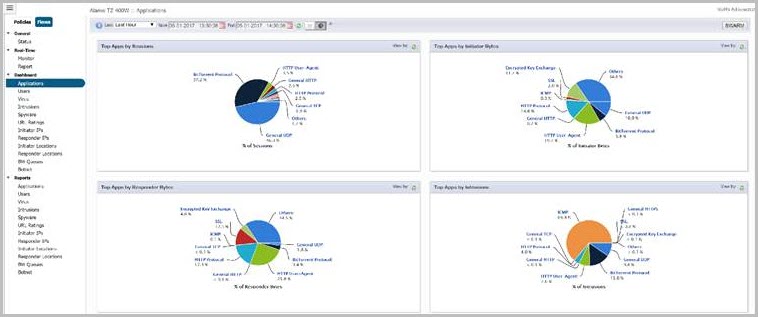
The Reports can be displayed in the following ways:
|
•
|
Table View - Data can be sorted on any column.
|
|
•
|
Pie Chart View - Charts can be selected to either show total data or per entry. (For example, the Initiator IP tab by default shows the total sessions over time, total bytes over time, total intrusion over time, and so on.) You can also choose the same charts for individual IPs by selecting the Table view from the button bar at the top of the chart.
|
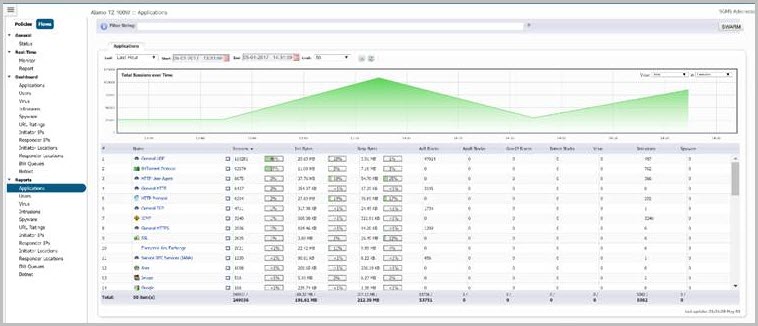
Reports > Applications
This provides a detailed view of reports that are similar to the Top Flow Dashboard reports described in Dashboard > Applications , but these reports are not limited to Top 10. You can get reports on the top 25, 50, 100, 150, 500, 1000, 5000, 10000, 25000, 50000, or unlimited incidents. In this section, you can sort the data displayed under any tab or column. Different tabs are provided to view individual data sets. You can also filter your data by configuring a text Filter String.
You can choose and visualize this data from any given moment (in the past) by clicking start and end points in the graph itself or by using the Start and End menus and clicking the Refresh icon. You can use the time drop-down menu to choose pre-configured hourly, daily, weekly, or monthly increments. You can also choose either a specific time range in the past by indicating a custom time or by selecting a moment from the last few hours, days, weeks, or months.
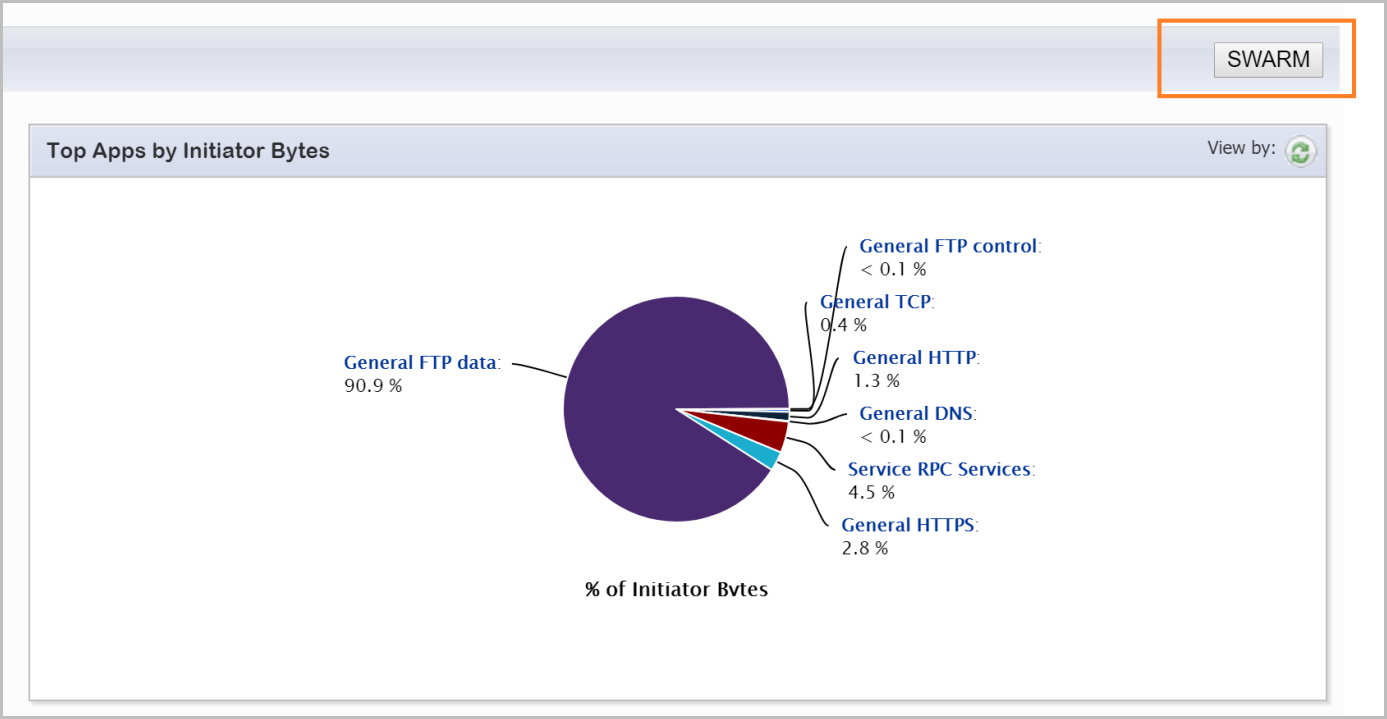
SWARM Report
This file can be exported by clicking “SWARM” in the top right corner of the following reports.
Flows > Dashboard Menu *
Flows > Reports Menu *
The Download Application Visualization Report dialog appears.
Click Download to receive the report of your network traffic between the dates you indicate.
Refer to the https://www.sonicwall.com/partners/swarm-report.aspx for detailed descriptions and steps on how to upload reporting data to MySonicWall.com and to produce a report in a PDF format.
Online Training
To view the free, online Certified SonicWall System Administrator training course for GMS, see https://support.sonicwall.com/sonicwall-analyzer/training/109/global-management-system-certification-cssa-level-course.